3 Tips for Success with Big Data
The amount of data that is being collected has been increasing exponentially over the last few years.
An unending stream of Social Media data is already being used to target advertising, and big data has already demonstrated its true value in this context.
Organisations of all kinds have started to realise it’s time to jump on the bandwagon. And this is not just about hype either. Big data is a game changer with real value for almost any business that learns how to use it. Organisations that choose to ignore it will be easily outcompeted by companies who embrace it.
Companies that have started to take advantage of the unique insights provided by big data have improved in operational efficiency, revenue growth, and the creation of new business models.
In order to start taking advantage of big data, there are several fundamental principles about working with it that you need to consider.
In this article, we’ll discuss 3 tips for success with big data:
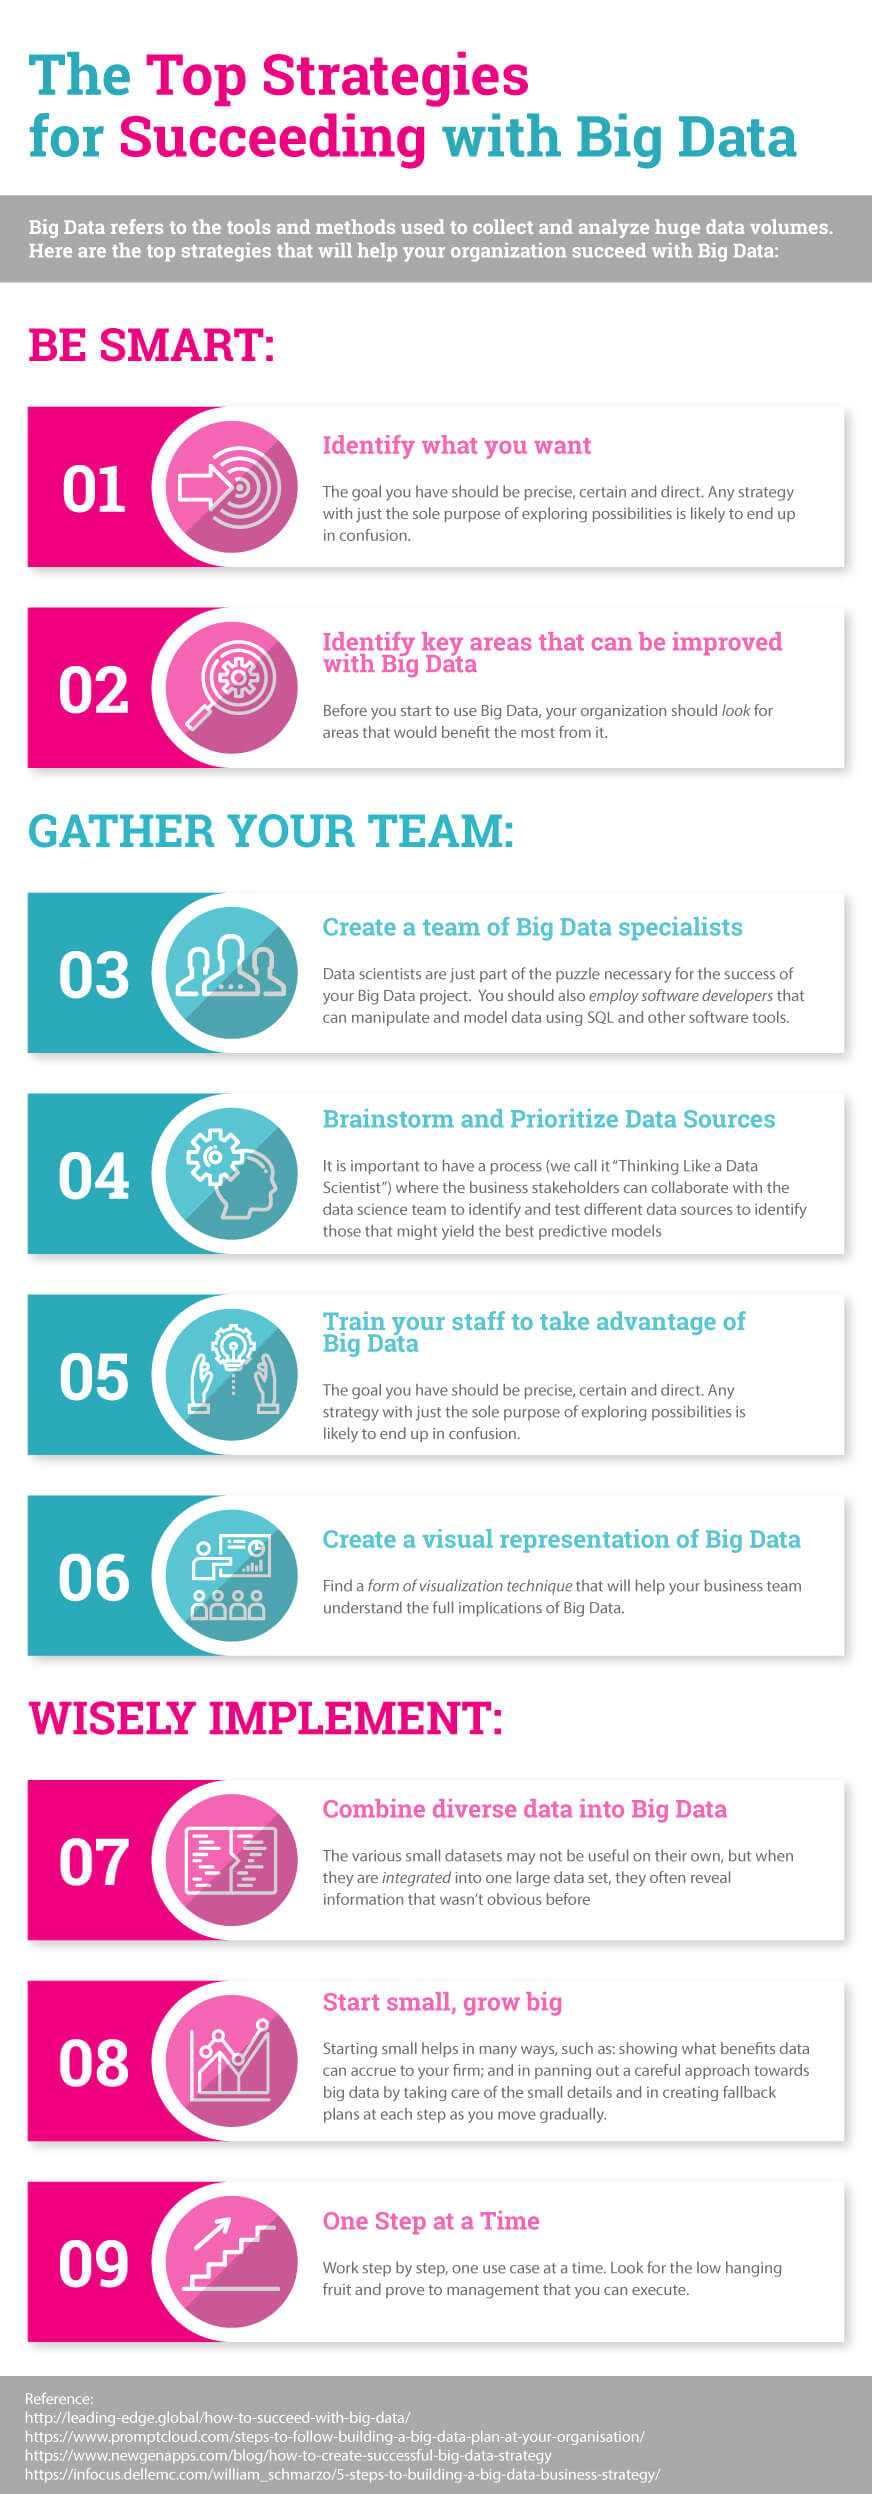
1. Visualise Big Data
Big data is composed of multiple data streams. To understand it better, it needs to be brought down to the eye level. And that means employing some sort of visualisation technique to get a comprehensive look at it. In fact, a report by Aberdeen Group states the following when it comes to the importance of visualising big data:
“At organisations that use visual discovery tools, 48 percent of Business Intelligence (BI) users are able to find the information they need without the help of IT staff”.
Interestingly, that number drops to just 23 percent without the help of visual discovery tools. What’s more, managers using visual data discovery were 28 percent more successful in finding timely information, and you can really see the case for visualisation.
But not only does visualisation help managers get information faster, it also encourages interaction with data. Managers who use visualisation tools, interact extensively with data as compared to those who don’t (33% vs. 15%). This sort of interaction also causes managers to raise more questions, which is great for extracting further information from data.
Visualisation presents data in a form that the brain can make more sense out of – it’s just a better way of presentation. Visual analysis of data also promotes the following productive practices:
-
Look at additional data sets: Because you’re asking more questions, you’ll need additional data to address them adequately.
-
Vary how you visualise the data: There are multiple ways to look at the same data. Each of these ways answers a different set of questions you might have. Thus, you enter into a phase that’s called the “Cycle of Data Analysis” – you get data, analyse it, ask or answer questions, and the cycle continues. And during each cycle, you might need to drill down, up or across data to get exactly what you want. You might need to access even more data, which in itself will give rise to additional views. This approach really promotes better understanding and insight.
2. Enable your staff
You must have come across certain people who are obsessed with gaining ever-deeper insight. They’ll keep raising questions that are likely to create a lot of value for their business. And big data magnifies this behaviour – these people now have more data than ever to analyse and gain insights from.
The difference that big data makes for an organisation is quite pronounced as well. In fact, organisations with big data are 70 percent more likely to have business intelligence projects that are handled and driven by the business community and not by a bunch of IT specialists. Big data empowers business users who no longer have to put up with the IT department and their archaic methods of data management.
Big data can always provide an insight that simply wouldn’t be possible with traditional data sources. So instead of waiting for IT to perfectly cleanse data and prepare it for analysis, it’s possible to use big data tech to just explore the data and see if it holds anything of value.
3. Integrate diverse data sets
Big data is made out of many small datasets. These datasets in isolation might not offer much value, but when presented as a big data package, they often offer significant value.
For example, in the consumer packaged goods industry, executives may get a better understanding of customer behaviour when they combine product preferences with actual purchase data.
Organisations can get a tremendous amount of value by combining relatable data, even if they don’t come in the same format. This is how big data is created from smaller datasets – it’s semi-structured data captured from multiple streams. Consolidation of smaller datasets needs to be done – spreadsheets, databases, data warehouses, and even filesystems such as Hadoop.
After you’ve handled consolidation for these, you’ll always have the data you need to answer critical questions about your business and its processes.
Enjoy the read?
We're passionate about helping businesses achieve their potential - I hope you found this article useful.
Want to see what we can do for your business? Contact me
More blogs
Workshops


In this 1 day course you will learn the foundations of Change Management so you can develop your own practical change management plan to use with your team. You will also learn to increase ROI of the change investment, create a culture of resilience, engage staff and encourage loyalty.